Swapstracker: one binary, 3.1 billion trades, one small board
How I took Swapstracker from a one-year backfill estimate on my first, TypeScript version to a 20-day backfill with a Go rewrite and TimescaleDB on a Radxa ROCK 5C.
Both versions are my own proprietary code. This write-up describes the design at a high level only.
What it does
Swapstracker follows DEX trading on EVM chains. It reads swap events from Uniswap V2, V3 and V4-style pools,
prices each trade in USD and serves trades, pair statistics and OHLCV candles through an API. New trades are
pushed live to a SvelteKit frontend.
This write-up covers two chains, Ethereum and BSC, over two years of history.
The platform supports more EVM chains. Every figure on this page refers only to Ethereum and BSC.
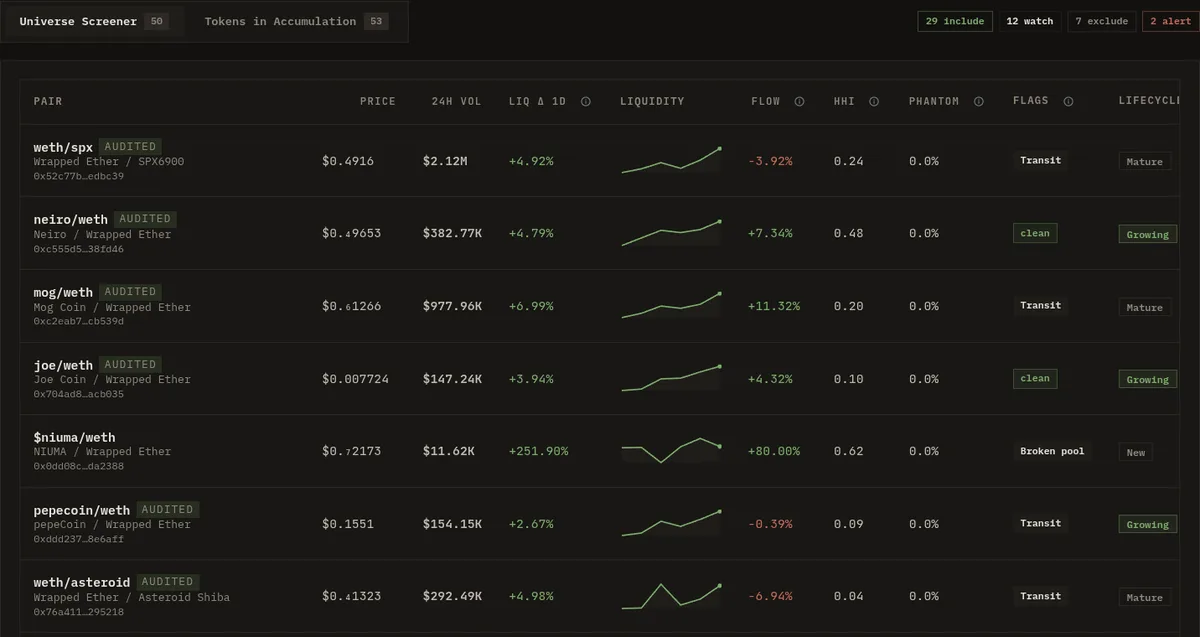
What the indexed trades turn into: a screener with liquidity, order flow and holder concentration per pair.
Where the time went
I wrote the first version of Swapstracker as a set of TypeScript microservices writing to MongoDB. Each service made sense on its own.
Together they spent a large share of CPU and memory turning objects into messages and messages back into
objects, only to hand the data to the next service.
I track progress in blocks per second, logged continuously. At the rate my first version sustained, the logs
projected roughly a year to backfill two years of both chains. That number is a projection: I did not let the
first version run for a year to confirm it.
What I changed
One binary for the path from logs to trades. Extraction, pair resolution, timestamps, pricing
and persistence became stages of a single Go process, passing in-memory structs to each other.
Fewer boundaries, fewer transformations. Removing the hops between services removed the
serialization and parsing that came with each one.
PostgreSQL with TimescaleDB instead of MongoDB. Trades are time series. Hypertables,
compression and continuous aggregates fit that shape.
Measurement stayed on. Blocks per second remained in logs and metrics, so every change showed
up as a number.
This is not a Go versus TypeScript result. Architecture, data access and storage changed together.
My first version
Current indexer
Simplified. The exact number of old services is not the point; the hops are.
The indexer is one process; the platform is not. The API, Redis, the database and the frontend run as their own
services.
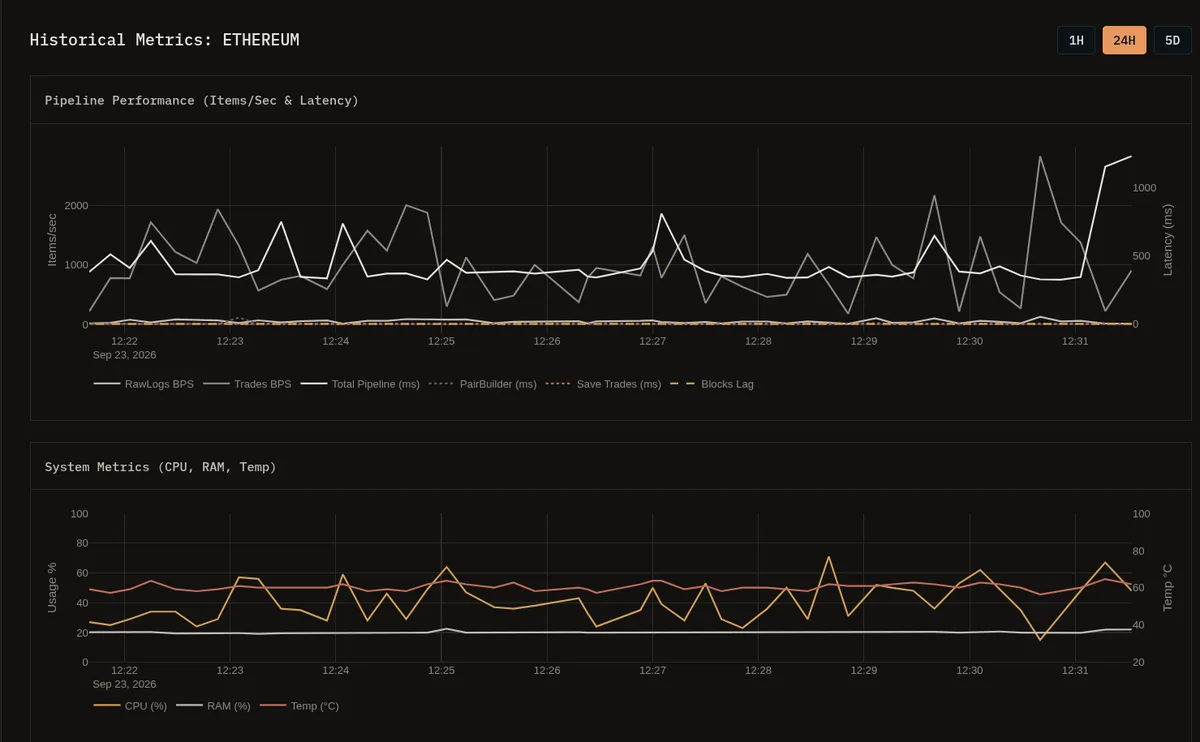
The indexer reports its own throughput, stage latencies, block lag, CPU, RAM and temperature. Ten minutes of live Ethereum indexing on 23 Sep 2026; a monitoring view, not a benchmark.
Parallel, but in block order
Inside the indexer, an allocator hands out consecutive block ranges, sized by the batch optimizer. Several
workers take ranges at the same time. Each one fetches its logs, then resolves pair metadata and block
timestamps concurrently, checking the local cache before asking the network.
Workers finish in whatever order the network allows, so their batches pass through a reorder buffer. A single
committer prices and writes them strictly in block order, so the stored history grows contiguously even while
extraction runs in parallel.
A fixed number of in-flight slots caps how many prepared batches can wait at once. When one range is slow, the
other workers stop taking new work instead of filling memory.
The worker count adapts at runtime. The ordering does not depend on it: only the committer writes.
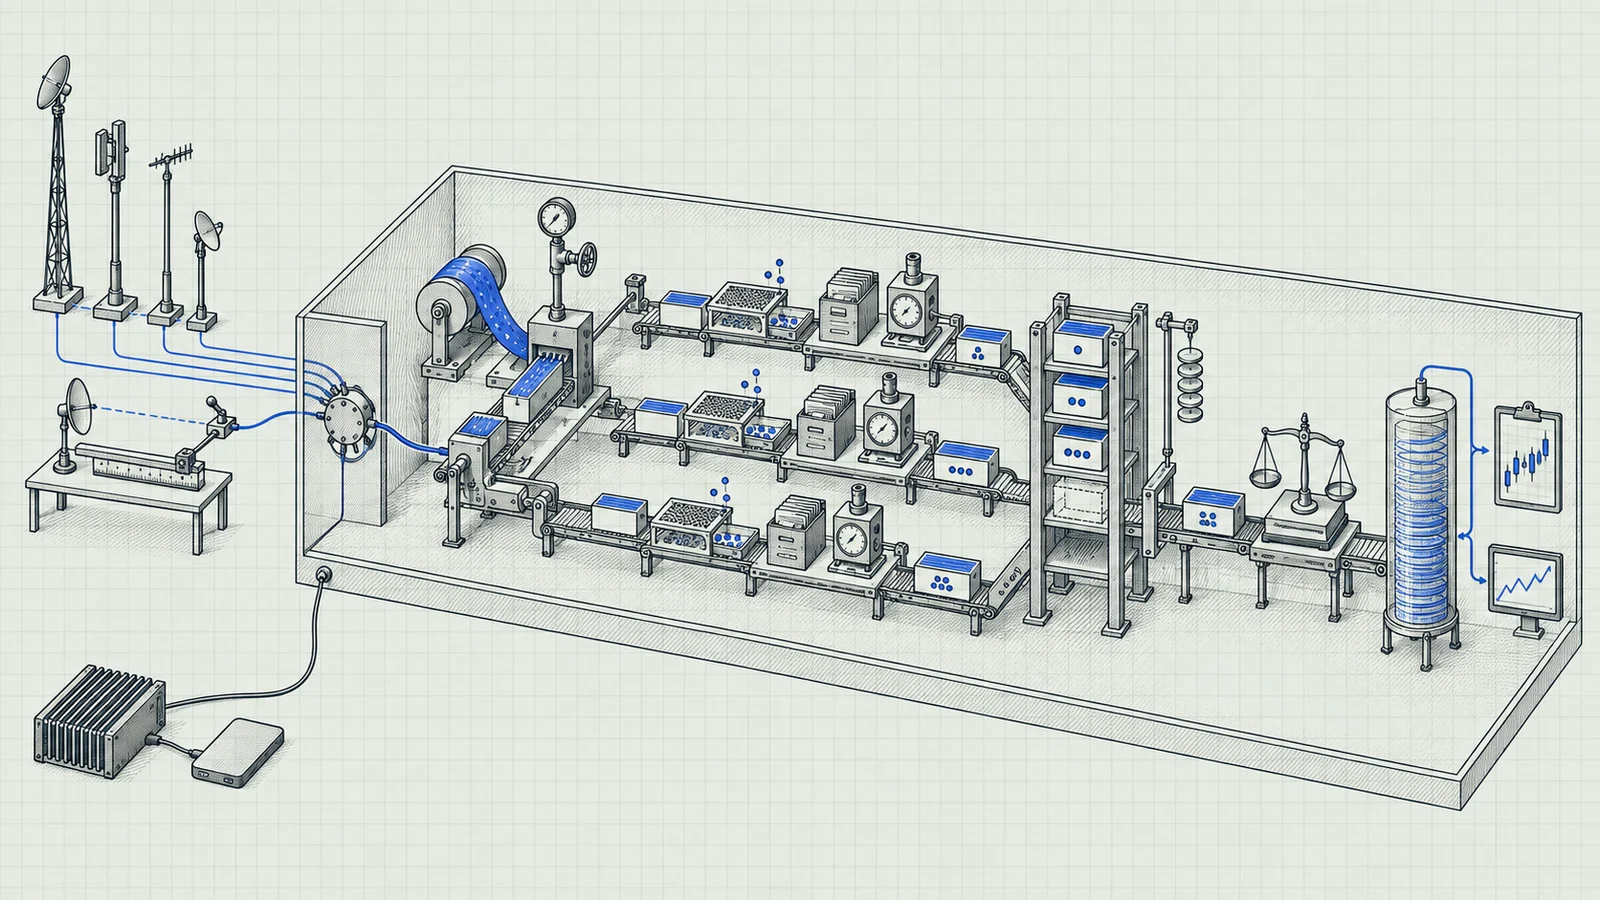
1234567
RPC providers, checked against baselines, with failover between them
Batch size adapts to provider health and log density
Parallel workers extract logs, resolve pairs and assign timestamps
Reorder buffer: finished batches wait for their turn
One committer prices trades in memory and writes in block order
TimescaleDB, feeding candles and live trades
The Radxa ROCK 5C and Samsung T7 running it
An illustration of the design, made with an image model from my description of the indexer. Not a screenshot.
Results
With those changes, the two-year backfill of both chains finished in 20 days. The history now holds more than
3.1 billion trades in about 1 TB of compressed storage, and the indexer uses around 80% less RAM than my first version
did.
I also saw CPU temperature drop by roughly 15 °C. Temperature depends on load and room conditions, so I keep it
as an observation, not a result.
Measurement log
3.1+ billion
trades stored, two years of Ethereum and BSC
observed
1 TB
compressed history, on a 2 TB SSD
observed
20 days
to backfill those two years, both chains together
observed
≈ 1 year
what my first version projected for the same job
estimate from logged blocks/s
80% less
RAM after the rewrite
reported, no reproducible benchmark yet
An estimate against an observation, not a controlled benchmark. Architecture, data access and storage all changed together, so no single factor gets the credit.
The machine
All of this runs on a Radxa ROCK 5C single-board computer with a 2 TB Samsung T7 SSD attached over USB. The
compressed history takes about half of that disk. The same board also serves HabitsFlow and GroupBrain, and the
three apps reach the internet through Cloudflare Tunnel.
The board does not run full EVM nodes. Chain data comes from RPC providers; the indexer’s job is to get as much
as possible out of every request and do the rest locally.
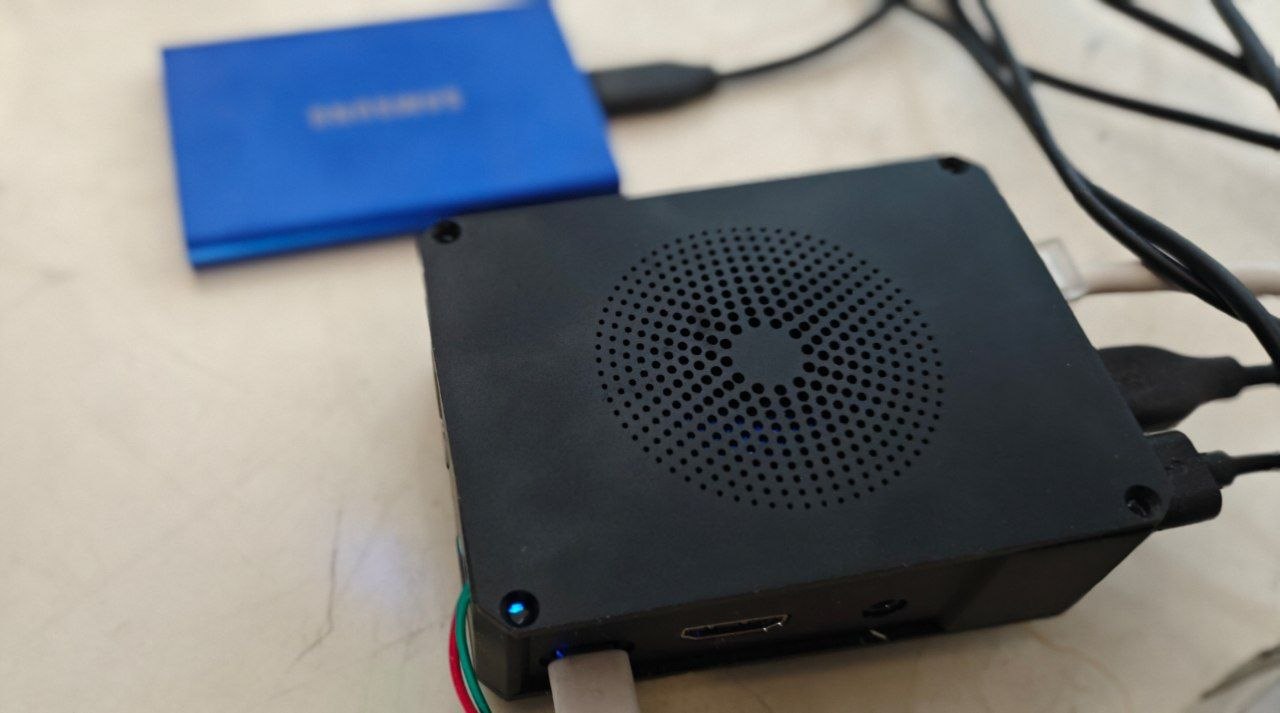
Samsung T7, 2 TBRadxa ROCK 5C
Radxa ROCK 5C, Samsung T7, 2 TB. Runs Swapstracker, HabitsFlow and GroupBrain, published to the internet through Cloudflare Tunnel.
Serving candles and live trades
Candles. TimescaleDB continuous aggregates, one set per chain, keep OHLCV rolled up in advance,
so chart queries read summaries instead of scanning raw trades.
Concurrent reads. Identical requests that arrive at the same time share one database query
through Go’s singleflight. It collapses in-flight reads; it does not deduplicate stored trades.
Live trades. New trades go out on Redis Pub/Sub and fan out to WebSocket clients, so the
frontend does not poll.
I call OHLCV latency low. I have not published a p95 yet, so there is no millisecond figure here.
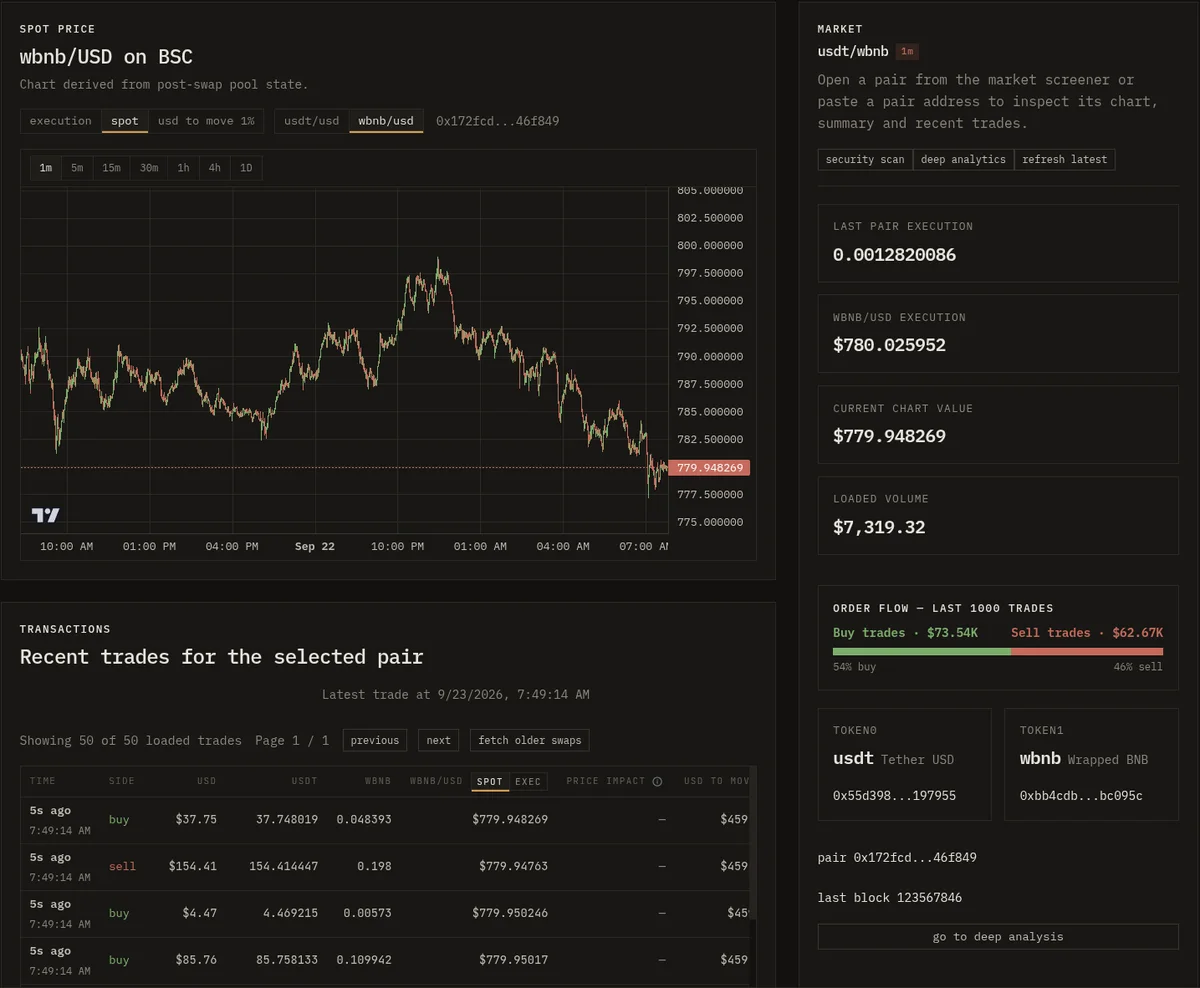
A BSC pair page: one-minute candles from post-swap pool state, the latest trades as they are indexed and buy/sell flow over the last 1,000 trades.
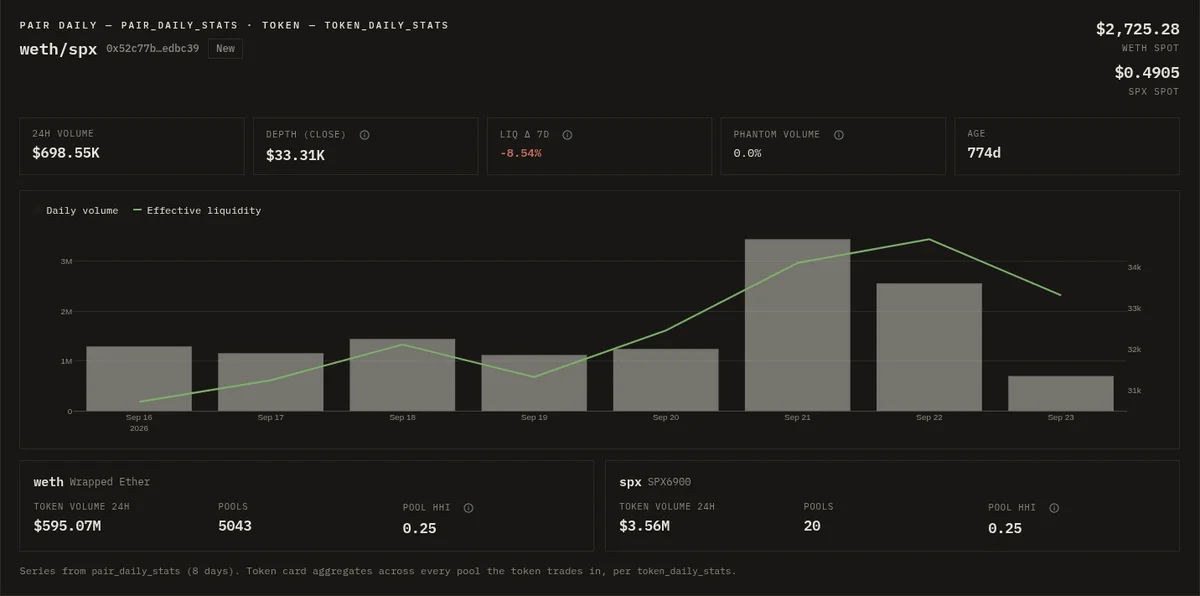
Daily statistics per pair and per token, rolled up from the indexed trades: volume, depth, liquidity change and pool concentration.
Keeping the RPC side honest
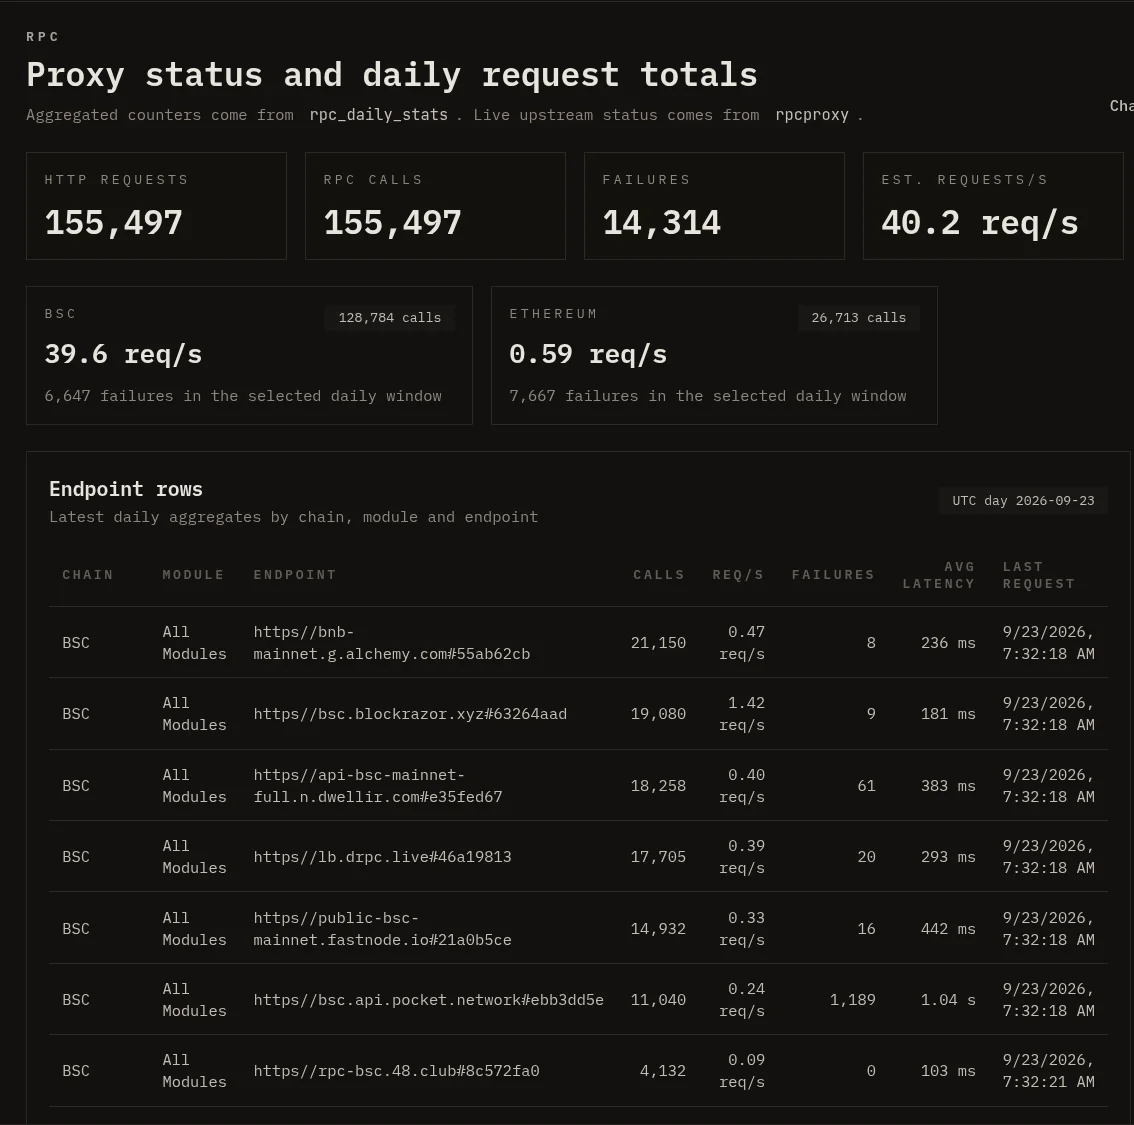
Public RPC endpoints vary a lot. Some drop old history, some time out, some return incomplete logs. The indexer
fails over between providers, and candidate endpoints are checked against baselines, known results for fixed
block ranges, before they are trusted.
Pricing itself is in-memory math over pool state. RPC is needed for logs, token metadata and block timestamps,
and the last two are cached locally. Batch sizes adapt to log density: the optimizer aims for about 35,000 logs
per batch and backs off when a provider struggles.
35,000 is a batch-size target, not a throughput figure and not a hard limit.
One UTC day of the RPC proxy: calls, failures and latency per provider endpoint. About 9% of calls failed that day, which is why failover and baselines exist.
What I have not measured yet
The numbers above come from my own logs. To make them something another engineer can reproduce, these are next:
sustained logs per second on this board, for a fixed chain and block range;
how far behind the chain head the live indexer runs;
p95 latency of OHLCV queries;
recovery time after an RPC provider fails.
They will land on this page, with the method, once I have them.